Author: Paul G. St-Aubin, P.Eng, Ph.D.
Senior Product Manager, Transportation Safety
Even if you do not practice road safety analysis in North America or if you do not use HSM methodology formally, the 6 steps of the RSMP are universal concepts that apply to a global audience
AASHTO’s Highway Safety Manual 2010 (HSM) (download user guide) is in many ways a vital resource in understanding how road safety analysis is performed. Consequently, it is used by many transportation professionals in North America. Today I’d like to review one of the main topics covered by the manual, namely the Road Safety Management Process (RSMP) introduced in HSM Part B. The RSMP is comprised of 6 steps, each covered in detail in HSM chapters 4 through 9. Even if you do not practice road safety analysis in North America or if you do not use HSM methodology formally, the six steps of the RSMP are universal concepts that apply to a global road safety audience, irrespective of technology or quantitative methodology used, borne out of recurring road infrastructure life cycle management requirements.
Readers familiar with chapter 6 of PIARC’s Road Safety Manual may see familiar concepts in the RSMP. In fact, principles found in the RSMP arguably need not be limited to road safety analysis: some broad ideas about lifecycle management could also apply to other road infrastructure performance requirements, such as capacity and congestion, but more on this in another post. Figure 1 illustrates the 6 steps of the RSMP as an iterative process in the continual safety improvement of transportation infrastructure. I should also mention that all transportation professionals are stakeholders in this process in some form or another, including policy makers, planners, designers, engineers, consultants, and researchers.
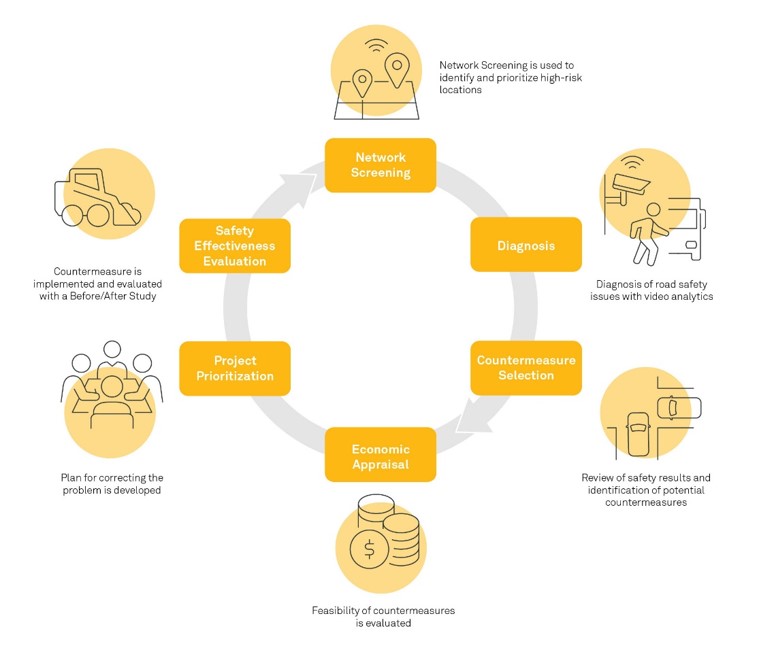
Figure 1: HSM 6-Step Roadway Safety
Management Process, AASHTO (2010)
You will find that your road safety activities will generally fall within one or more of these steps, even if you do not practice the 6-step RSMP formally. The RSMP is ultimately an iterative process to managing road safety with no clear start or end step. It is an iterative process, because managing roads and ensuring safety is an ongoing task, where road conditions, traffic compositions, and road user behaviour change constantly, from season to season, year to year, and decade to decade. Global events like COVID-19 also shape road usage and consequently safety. At the network level, many of these activities will be happening in parallel, possibly by different people.
Let’s start by reviewing Network Screening as this is perhaps the easiest step to jump right into.
Step 1 – Network Screening
In short, network screening is the process of triaging sites within a transportation network. This is a critical step because resources are finite and transportation networks are large; it is virtually impossible to affect change everywhere simultaneously. Network screening can help ensure that resources are allocated in such a manner that their impact is maximized. The selection criteria and performance measures used may vary from one jurisdiction to another, but in general, in this step sites are ranked, and those sites that are deemed to be the most dangerous (and consequently where the largest safety gains may be found) are prioritized. Chapter 4 of the HSM covers this topic in greater detail. Once we have narrowed the list of sites down to a manageable number, we can move onto the next step: diagnosis.
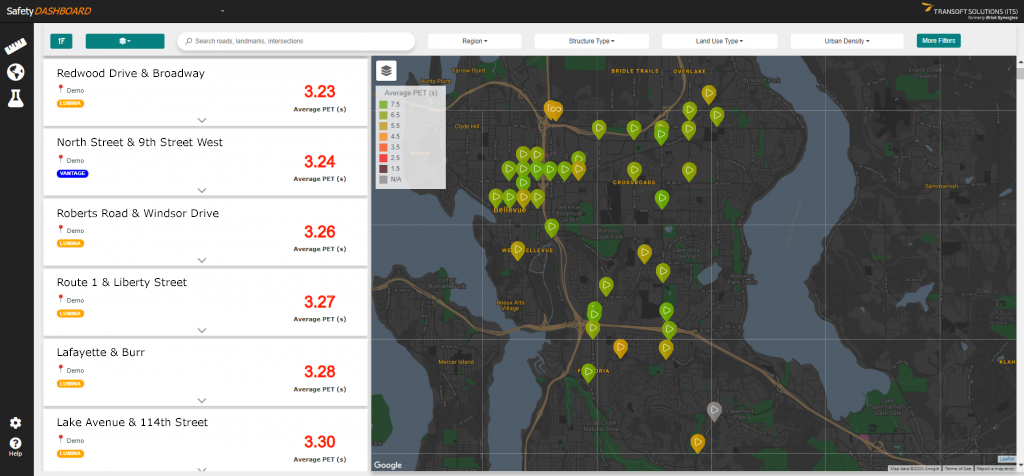
Figure 2: Network Screening of high injury network intersections on BriskLUMINA Safety Dashboard
Step 2 – Diagnosis
Diagnosis is the process of carefully investigating a site to determine what contributing crash factors may be present. Crash factors can exist within modes of transportation, road user behaviours, movements or interactions/scenarios, road design elements and features, traffic control schemes, the built environment, or operating conditions. Investigation may be undertaken qualitatively, through field assessment and public consultations, or through quantitative methods, including crash and conflict data review. Statistical and/or analytical tests are usually performed at a site level to rigorously identify contributing crash factors. Chapter 5 of the HSM covers this topic in greater detail. The evidence collected in this step will help prioritize relevant safety countermeasures in the later steps.
Step 3 – Countermeasure Selection
Safety practitioners use the results of the diagnosis tests and their judgment to recommend countermeasures that are expected to address the identified contributing crash factors, chosen within the constraints of the project, and that are known to be effective e.g. using crash-modification factors (CMF). Countermeasures can effect road design changes, public awareness and education campaigns, enforcement activities, or even Emergency Medical Services (EMS) policies. Some organizations compile their own list of known countermeasures and CMFs, such as the FHWA CMF Clearinghouse. Countermeasure effectiveness can vary from region to region, so CMFs estimation accuracy will be limited in the absence of prior representative trials. Proactive monitoring and evaluation combined with choices that emphasize flexible countermeasures can mitigate that risk; more on this throughout the next three steps. Chapter 6 of the HSM covers this topic in greater detail.
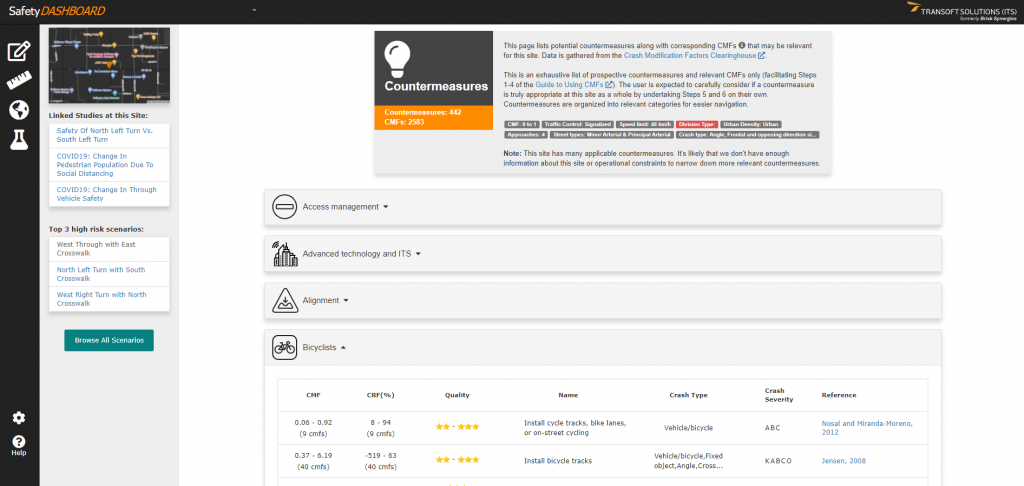
Figure 3: List of potential countermeasures along with corresponding CMFs on BriskLUMINA Safety Dashboard.
Step 4 – Economic Appraisal
With a shortlist of potential safety countermeasures, a thorough economic appraisal of each option can be undertaken. This will usually take the form of a cost-benefit analysis for each proposed countermeasure. This maximizes the potential safety benefit per dollar spent (and therefore total safety benefit). Implementation cost is usually measured using monetary value, e.g. construction cost. Preliminary design might take place in order to facilitate cost estimation. Meanwhile benefits are estimated. Sometimes safety performance measures are used directly (estimated with a safety performance function, SPF) but other times these are converted to an equivalent monetary value as well (e.g. EPDO). Chapter 7 of the HSM covers this topic in greater detail.
Step 5 – Prioritize Projects
In a nutshell, step 5 is the process of creating a plan that implements the safety countermeasures that create the maximum road safety benefit within the total budget allocated to safety remediation. The HSM covers three methods: ranking by economic effectiveness, incremental cost-benefit analysis, and optimization. In practice however, safety often isn’t the only design objective of a transportation project, especially for new construction. In those cases, design choices are made in concert with all other project requirements. Chapter 8 of the HSM covers project prioritization in the context of safety remediation only. For projects of larger scope, the HSM recommends multi-objective resource allocation algorithms.
Step 6 – Safety Effectiveness Evaluation
Safety effectiveness evaluation is the assessment of how well a countermeasure performs once it is implemented. The objectives of this step are to:
- Validate that a countermeasure is performing as expected.
- Produce CMFs for future projects (especially if they are pilot projects).
- Apply proactive corrective action as a project risk mitigation strategy.
Safety effectiveness evaluation thus leads back into step 1 with updated site triaging information for the next round of road safety countermeasure projects. Chapter 9 of the HSM covers this topic in greater detail.
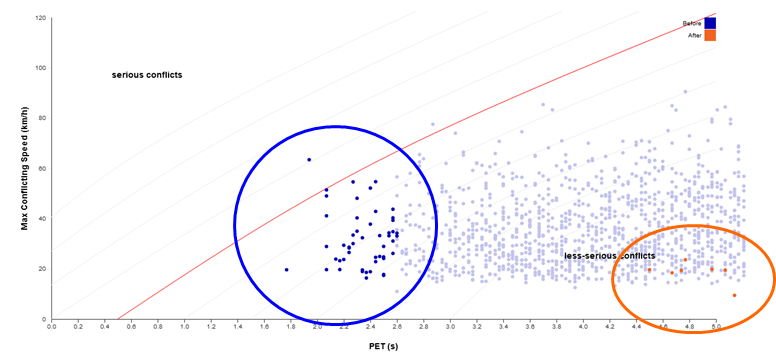
Figure 4: Interactions measured by the Post-Encroachment Time Before vs. After a countermeasure was implemented.
Performance Measures
Throughout most of the RSMP steps, performance measures are used for decision making. The choice of performance measure used will be guided by the objectives and priorities of the existing policy and safety management program. Often only one or two performance measures are used at a time, especially in Network Screening and Diagnosis because performance measures can often create conflicting priorities on policy objectives–see Figure 5. For example, the same countermeasure that decreases overall collision severity (i.e. average lower injury rate) may simultaneously also increase crash frequency (i.e. total number of crashes). More performance measures might be used in the later steps to verify that countermeasures do not compromise comprehensive safety requirements across multiple safety objectives simultaneously.
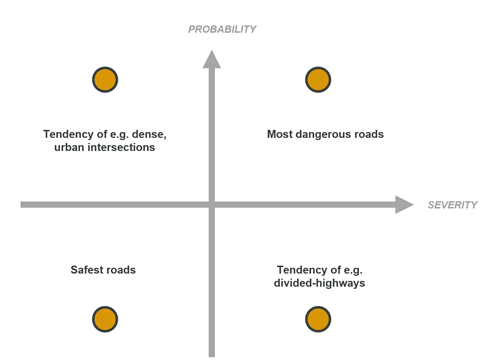
Figure 5: Aspects of Road Safety
Typical performance measures might include (but are not limited to): equivalent property damage only (EPDO), KABCO rate, crash frequency, crash rate, infraction/conflict frequency/rate, speeding rate, any of the previous measures estimated from safety performance functions (SPF), and estimates with or without Bayesian adjustment.
What Solutions Does Transoft Provide to Help Me Achieve
Each Step of the RSMP?
Transoft Solutions provides road safety professionals with tools to facilitate most of the steps of the RSMP. Transoft’s BriskVANTAGE and BriskLUMINA products facilitate data collection, analysis, and visualization activities encountered in Step 1 – Network Screening and Step 2 – Diagnosis. These products also integrate FHWA CMF Clearinghouse data to accelerate Step 3 – Countermeasure Selection. Transoft Solutions offers a wide array of engineering CAD software to assist engineers with design activities and subsequent cost estimation undertaken in Step 4 – Economic Appraisal and in the final design stage between Step 5 – Prioritize Projects and Stage 6 – Safety Effectiveness Evaluation. BriskVANTAGE and BriskLUMINA can once again be used to perform follow-up studies as part of Step 6 and the information collected is fed back into Step 1 to renew the entire process.
