Trip generation is the first step of your traffic impact study or assessment. Trip Generation leads to infinite possibilities for the amount and type of traffic a particular site could generate on the network system.
Estimate the number of trips, by land use, that is produced by your development project. Go into a deeper dive and sub-divide your trip generation into parts – such as internal capture, pass-by and diverted trips.
Adding Land Uses
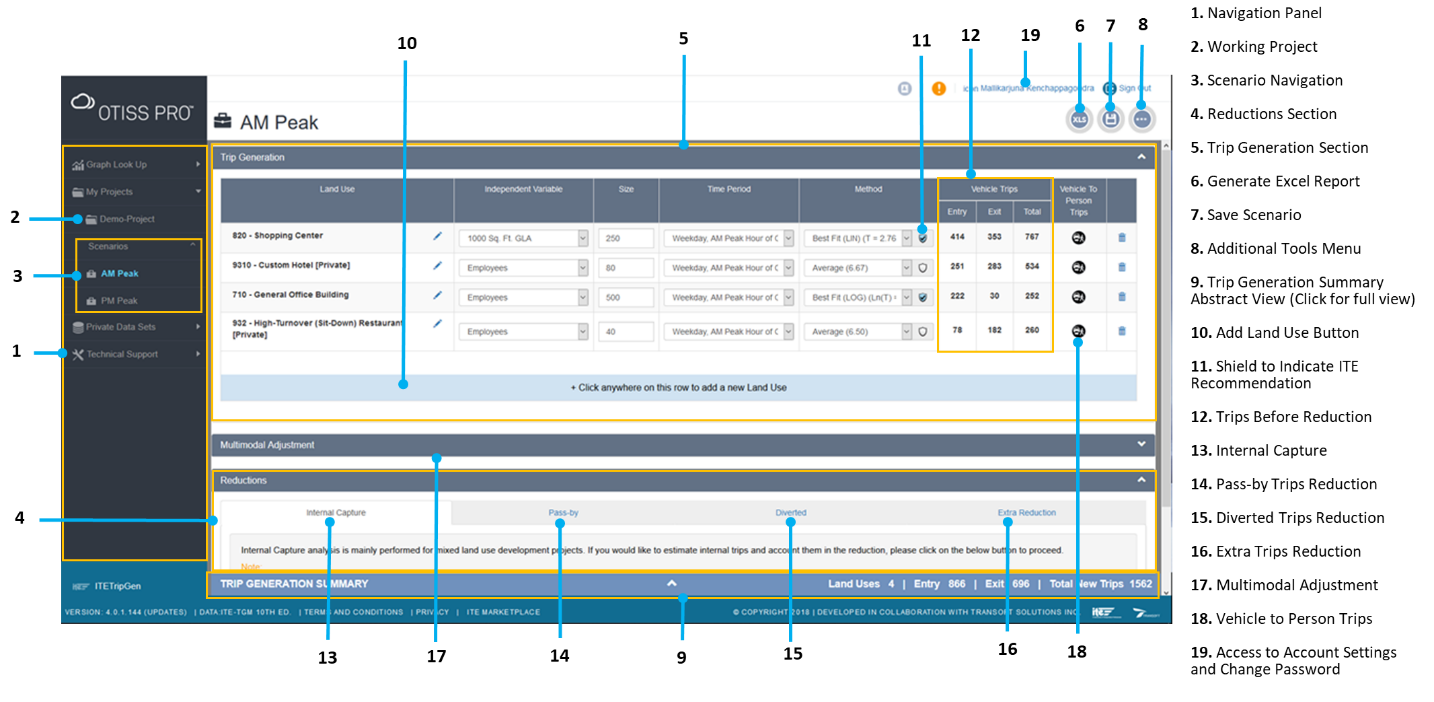
- On the New Scenario page, click the highlighted row to add a new Land Use.

- In the Add New Land Use dialog box, you can:
- Select trip generation data from the Data Source list. If you need to use a custom average rate or an equation, create a private data set, and then select the Private Data Set as the data source.
- Enter the Land Use Code and click the search icon to find the record. Alternatively, you can select the location type that matches your study area from the Settings/Location list and the appropriate Land Use Category and Land Use.
- Click the Add button to add the land use.
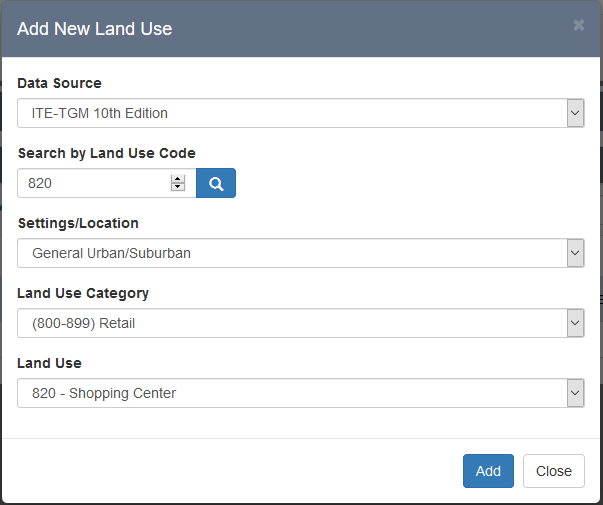
- To add multiple land uses, repeat Step 2. In the example below, four land uses have been added.
Providing Land Use Inputs and Estimating Trips
-
- Independent Variable: Unit of land use size per your study site data
- Size: Number of units as per the study site data
- Time Period: Time period based on the available data
- Method: Equation for the calculation method. For each land use added, you can provide additional details such as Independent Variable, Size, Time Period, and Method. The program will display the calculated vehicle trips for Entry, Exit, and Total.
- For this example, use the following inputs shown in the figure below:

- At the bottom of the Scenario view, you will immediately see the estimated number of trips shown in the Trip Generation Summary. To see the full trip generation summary, click on the condensed view and the view will expand into a full Trip Generation Summary window.

Performing Trip Adjustments and Reductions
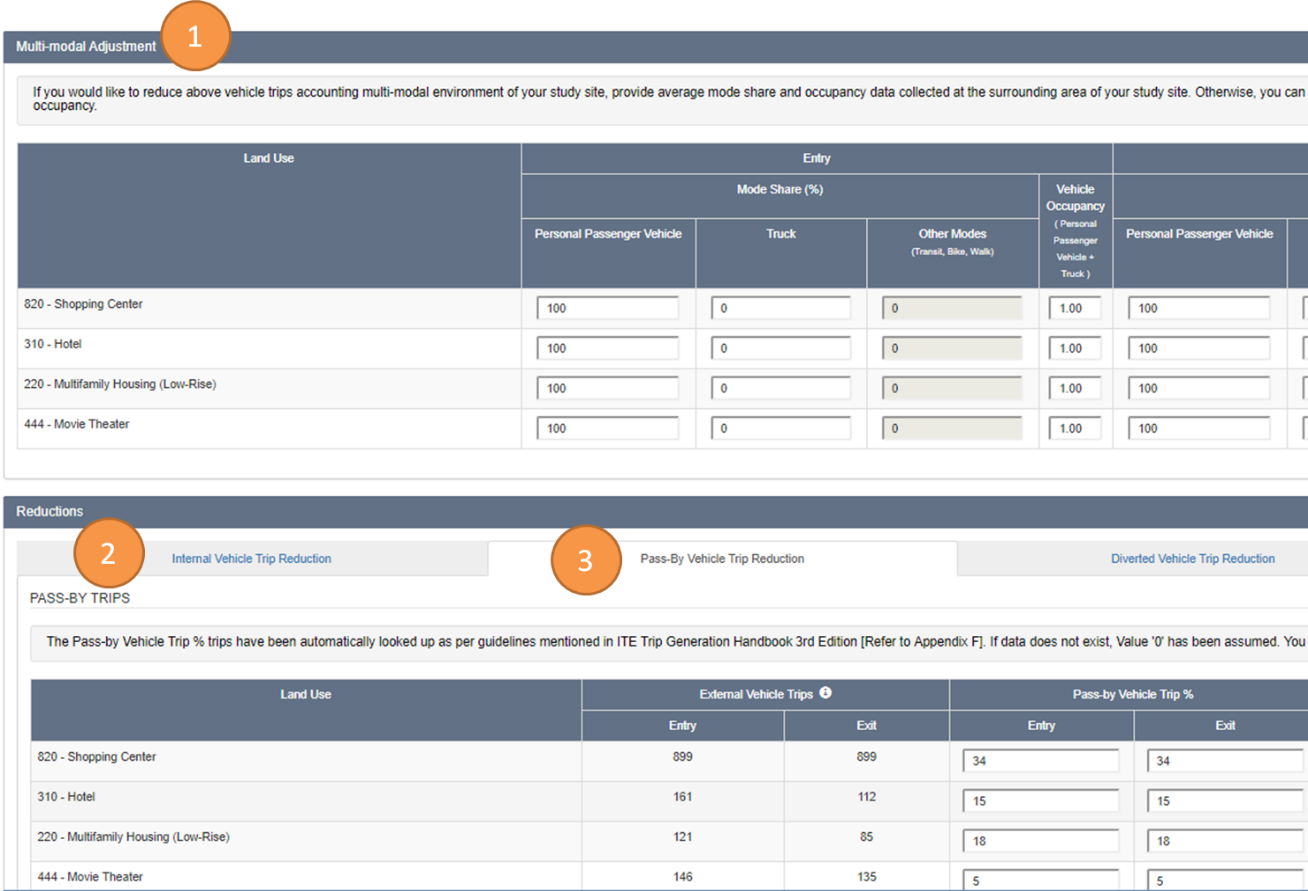
Once the vehicle trips are estimated for each land use, you can perform trip adjustments and reductions using the Multi-modal Adjustment and Reductions sections located below the Trip Generation section. (1) Multimodal Adjustment (2) Internal Capture Trip Reduction and (3) Pass-by Vehicle Trips Reduction sections.
Accounting for Multi-modal Friendly Study Sites
Vehicle trips are estimated assuming each trip is made only by a vehicle with single occupancy (mode share = 100 and occupancy = 1). If your study site is in a multi-modal friendly environment where trips are made by multiple modes, you can adjust the estimated vehicle trips by providing study site mode share and occupancy data.
- In the Multi-modal Adjustment section, provide mode share and occupancy details for personal passenger vehicle and truck.
- If there is a lower vehicle mode share at the study site compared to the data source, vehicle trips converted into other modal trips will be estimated and deducted from the original vehicle trip estimation.
- If there is a higher vehicle mode share compared to the data source, additional vehicle trips converted into vehicle trips will be estimated and added to the original vehicle trip estimation.
Estimating Internal Capture
- Select the Internal Capture tab and click the Estimate Internal Capture button to start the wizard. A four-step wizard will guide you through the inputs and estimations.
Note! Once you’ve started the wizard, you must complete the process before making changes to the Trip Generation Section or accessing any other part of the program.
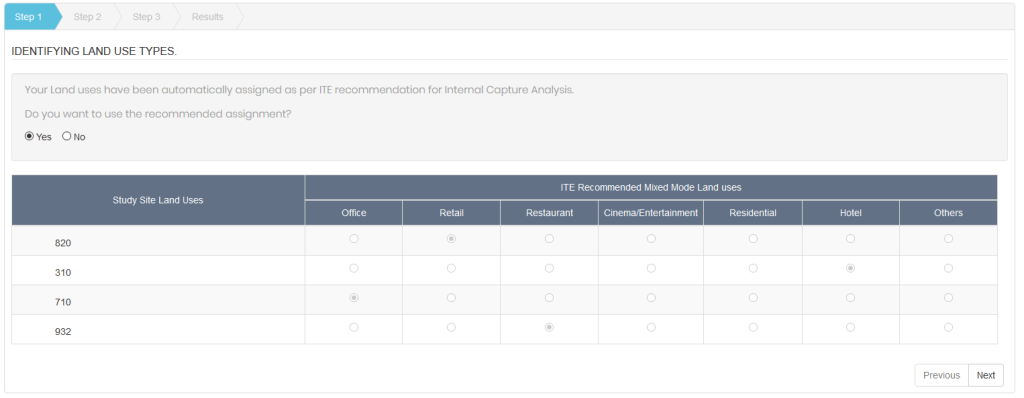
- In Step 1, the tool will automatically assign the defined land uses to the mixed land use categories suggested by ITE. ITE suggests UIPTC rates if the data exists. If you want to modify the rates, click the No button. If you would like to use the suggested rates, click Yes. Once the rates are confirmed, click Next to proceed to Step 2.
- In Step 2, the tool uses the estimated Exit Person Trips, Unconstrained Internal Person Trip Capture (UIPTC) Rates and Proximity Adjustment Factors (PAF) data to calculate the Unconstrained Internal Person Trips at Origin End.
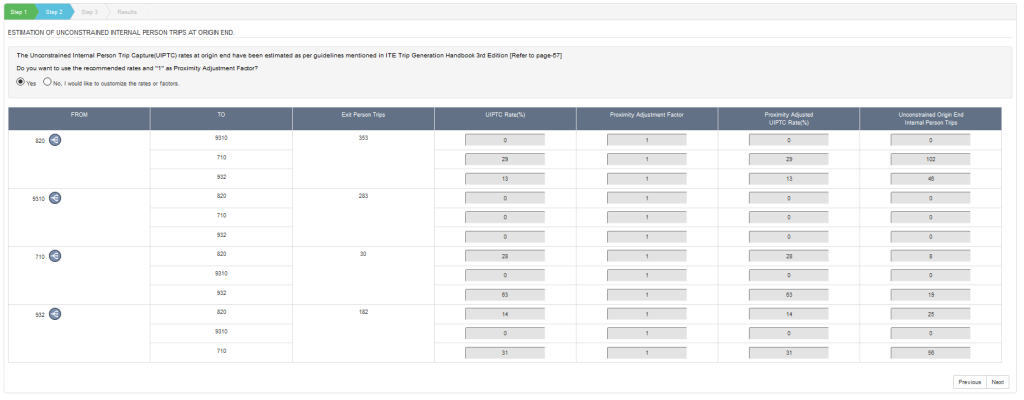
- In Step 3, the tool estimates the Unconstrained Internal Person Trips at Destination End using the approach described in Step 2.
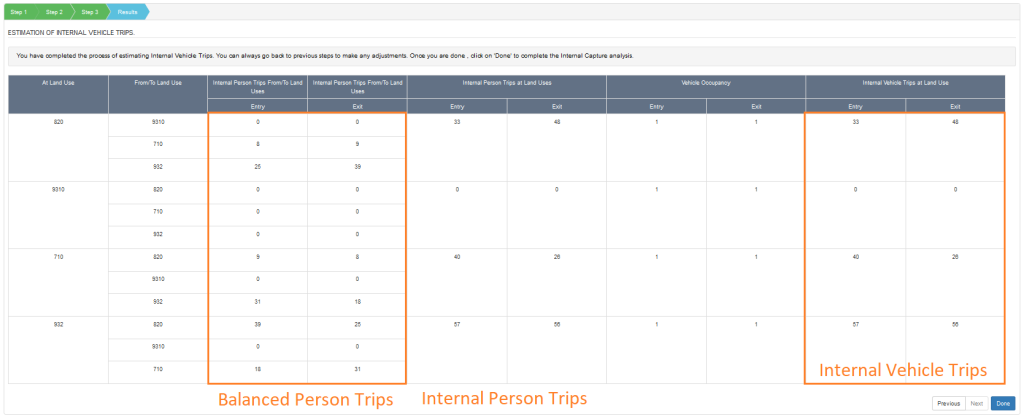
- In Step 4, the tool performs the balancing of internal person trips, converts person trips to vehicle trips, and reports the estimated Internal Vehicle Trips.
- Once the Internal Vehicle Trips have been estimated, you can review the inputs by going back through the previous steps or click Done to save the results.
Estimating Pass-by Trips
- Select the Pass-by tab to estimate pass-by trips.
- OTISS Pro will automatically fill the input fields and estimate the Pass-by Trips based on the ITE recommended pass-by trip rates for the land use and time-period combination. If there are no recommendations, 0% is assumed as a default. In the example below, some pass-by trip rates have been manually entered for demonstration.

- The estimated Pass-by Trips are categorized as Entry, Exit, and Total.
Estimating Diverted Trips
- Select the Diverted tab to estimate diverted trips.
- As with Pass-by Trips, OTISS Pro will automatically fill in the input fields based on the ITE recommended diverted trip rates for the land use and time-period combination. If there are no recommendations, 0% is assumed as a default. For the example below, some diverted trip rates are manually specified for demonstration.

Applying Extra Reduction
- Select the Extra Reduction tab if you would like to further reduce the trips after considering internal capture, pass-by, and diverted trips.
- Use the Extra Reduction Trips (%) – Entry and Exit percentage input fields to further reduce trips based on your project requirements.

Viewing Trip Summary and Reporting
- At the bottom of each Scenario page, you will see the Trip Generation Summary which provides a condensed view of the full trip generation summary.
- To see the full trip generation summary, click on the condensed view and the view will expand to a full Trip Generation Summary window.
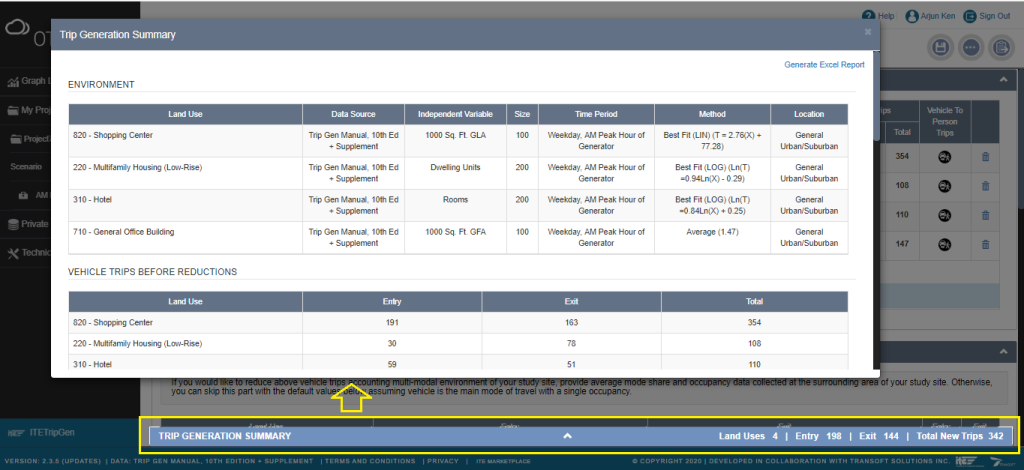
- Click Generate Excel Report to export the analysis results to a Microsoft Excel spreadsheet. To close the full Trip Generation Summary window, click X or anywhere outside the window.
Note: You can also generate a report by clicking Project Report in Excel in the Scenario menu.
